Lumax Industries |3QFY2019 Result Update
February 12, 2019
LUMAX Industries
BUY
CMP
`1461
Target Price
`2150
Y/E March (` cr)
Q3FY19
Q3FY18
% yoy Q2FY19
% qoq
Investment Period
12 Months
Net sales
431
371
16%
518
-17%
EBITDA
38
33
15%
45
-15%
EBITDA margin (%)
9%
9%
-7
9%
23
Stock Info
PAT
49
17
183.9%
21
133%
Sector
Auto-Ancillary
Market Cap (` cr)
1,366
In Q3 FY19, Lumax Industry Ltd. (LIL) has reported 16% growth on Y-o-Y basis on
Beta
1.3
52 Week High / Low
2585/1386
revenue front to `431 Cr as compare to `371 Cr in Q3FY18 largely on account of
Avg. Daily Volume
3,901
Face Value (`)
10
value growth. Growth in revenue is encouraging owing to flattish growth in sales by
BSE Sensex
36,343
major OEM in Q3FY19.
Nifty
10,876
Reuters Code
LUMA.BO
PAT has grown by 15% on Y-o-Y basis post adjustment of exceptional gain (one
Bloomberg Code
LUMX IN
off
` 36.20 Cr.) to ` 19.67 Cr as against ` 17.1 Cr in same quarter last year.
Operating margin has been remain flat to 8.8% in Q3FY19 as against 8.89% in
Shareholding Pattern (%)
Q2FY19.
Promoters
75.0
During the quarter LIL has added four new models in its portfolio such as Ertiga,
MF / Banks / Indian Fls
0.8
WagonR, Jawa and Marrazo we expect this will be key revenue driver for LIL in
FII / NRIs / OCBs
1.1
Indian Public / Others
23.2
coming quarter as launch of new model initially capture market share.
LED contribution to improve margin: Share of LED is remain same in the quarter
under review against previous quarter however it has improved from 8% in FY17 to
Abs.(%)
3m
1yr
3yr
35% in Q3FY19 but at same level compare to Q2FY19, However LIL enjoys 80%
Sensex
3.4
6.9
28.2
market share in LED lightning in CV segment, current penetration of LED in CV is
LUMAXIND
(11.1)
(35.7)
274.0
very low and management expect it to improve going forward as major OEM’s like
Ashok Leyland, Bharat Benz and Tatamotors are coming up with LED lightening in
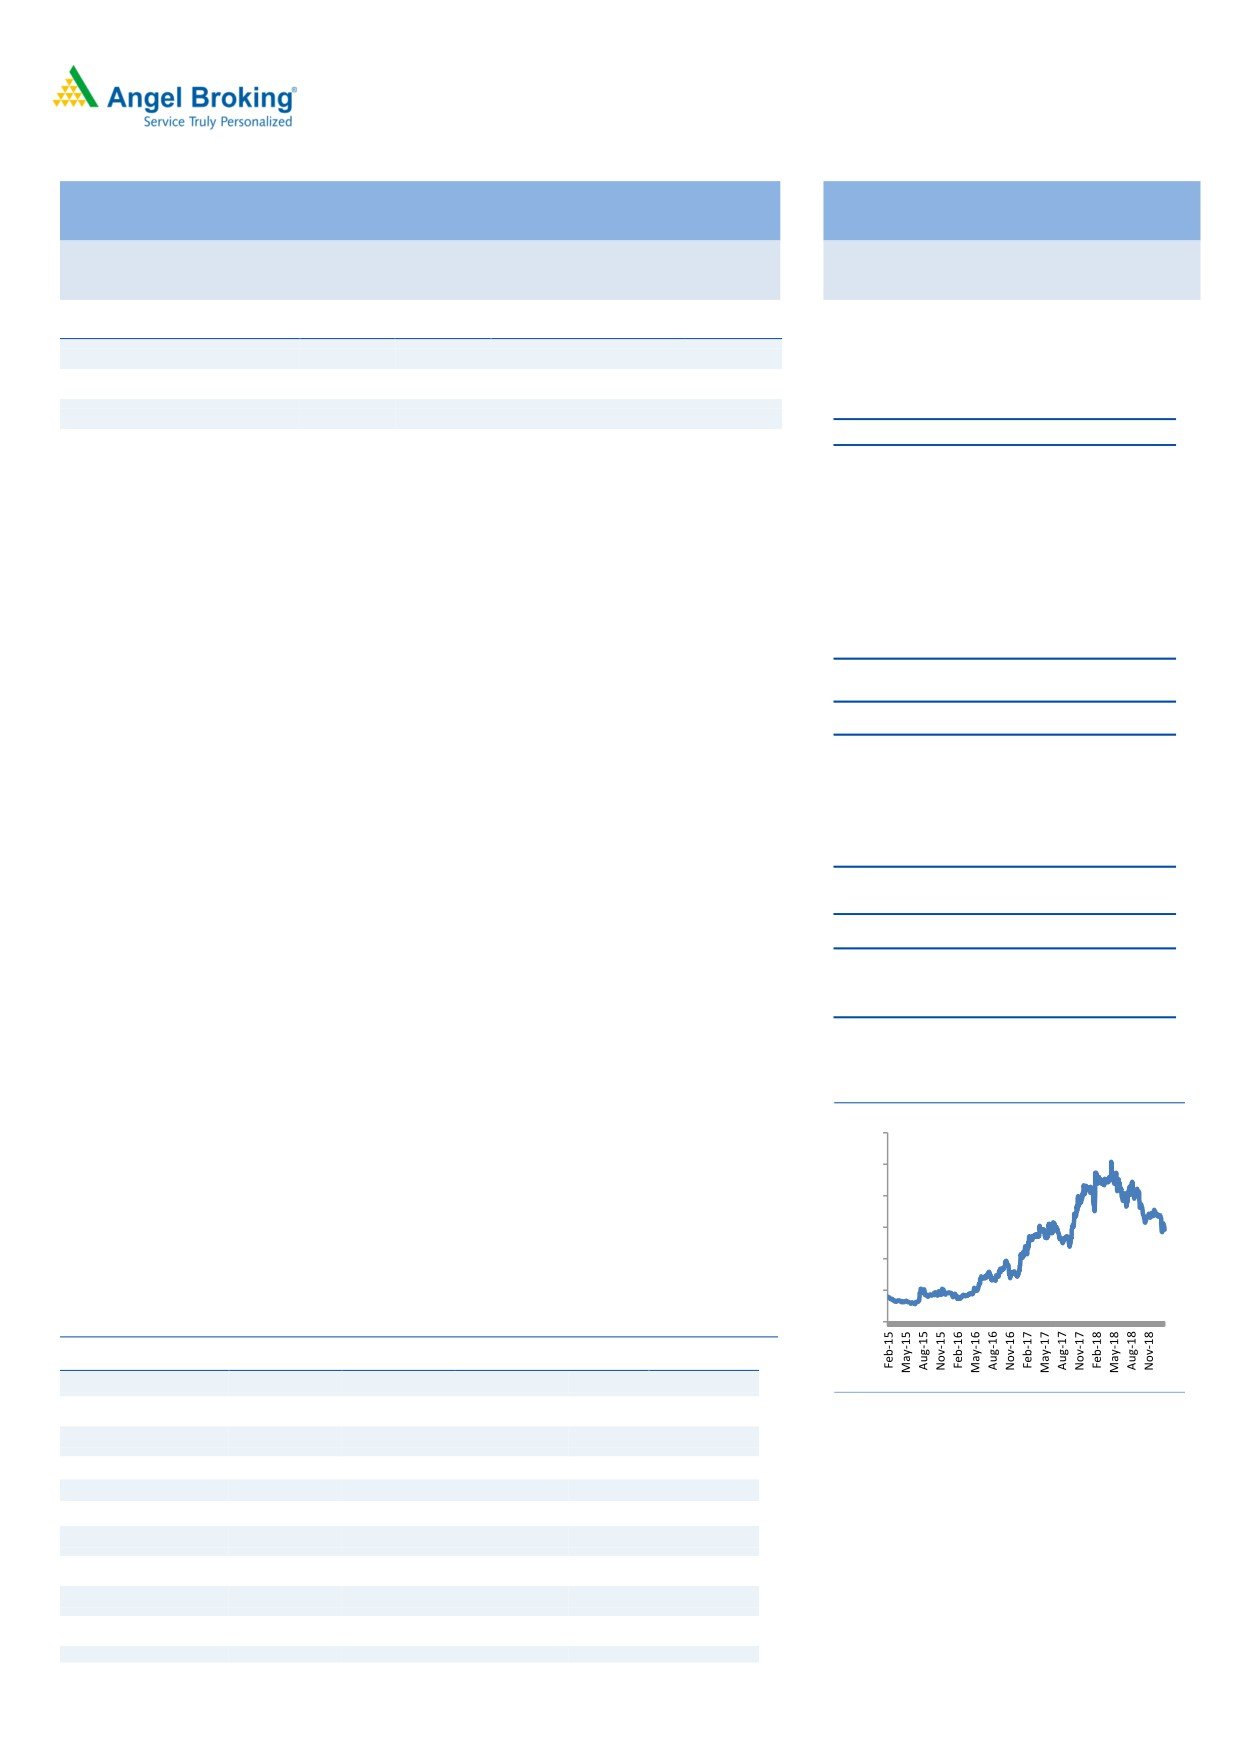
3 Years Performance charts
some newer model.
3000
Outlook and Valuation: Our long term bet on LIL is positive and we expect LIL to
2500
grow above the industry growth going forward. At the CMP of `1461 stock is
2000
available at 13X of FY20E EPS of `116. Recent correction in stock price provide
1500
good entry opportunity for investment. We maintain our BUY recommendation for
1000
target price of ` 2150 with potential upside of 47%.
500
Exhibit 1: Key Financials
0
Y/E March (` cr)
FY16
FY17
FY18
FY19E
FY20E
Net Sales
1,255
1,271
1,650
1,947
2,278
% chg
Source: Capitaline Angel Research
10
1
30
18
17
Net Profit
52
54
71
102
109
% chg
2,160
4
31
43
6
EBITDA (%)
7.1%
7.9%
8.2%
8.2%
8.9%
EPS (Rs)
39
58
76
109
116
P/E (x)
37
25
19
13
13
Kripashankar Maurya
P/BV (x)
5.1
4.4
3.8
3.1
2.6
022 39357600, Extn: 6004
RoE (%)
13.7
17.6
19.7
23.0
20.4
RoCE (%)
13.9
15.2
18.7
18.9
21.4
EV/EBITDA
16.5
14.2
10.8
8.7
6.9
February 12, 2019
1
Lumax Industries |3QFY2019 Result Update
Exhibit 1: Q3FY19 Performance
In Cr
Q3FY19
Q3FY18
Q2FY19
YOY %
QOQ%
Net Sales
431
371
518
16%
-17%
Total Income
430
371
518
16%
-17%
Total Expenditure
393
338
473
16%
-17%
Raw Material Consumed
275.91
239.6
341
15%
-19%
Stock Adjustment
-5.72
-7.7
4
NA
NA
Purchase of Finished Goods
4.37
1.9
3
127%
55%
COGS
275
234
348
17%
-21%
Employee Expenses
55
47
55
17%
0%
Other Expenses
62.87
56.5
69
11%
-9%
As a % of sales
Raw Material Consumed
64%
65%
66%
Stock Adjustment
-1%
-2%
1%
Purchase of Finished Goods
1%
1%
1%
COGS
64%
63%
67%
Gross Margin %
36%
37%
33%
Employee Expenses
13%
13%
11%
Other Expenses
15%
15%
13%
EBITDA
38
33
45
15%
-15%
Forex Loss (Gain)
-3.4
-1.5
4.3
Other Income
1.30
0.4
1.1
233%
20%
Exceptional Iteam
36.20
Profit from Associate
1.58
0.0
1.8
NA
-14%
Interest
4.19
1.1
3.7
271%
14%
PBDT
76.28
33.72
39.78
126%
92%
Depreciation
14.21
12
14
21%
3%
PBT
62.07
21.94
25.97
183%
139%
Tax
13.45
4.8
5.1
180%
164%
PAT
48.6
17.1
20.9
184%
133%
Ratios
BPS
BPS
EBITDA margin (%)
8.84%
8.89%
8.66%
-5
18
PAT margin %
11.29%
4.62%
4.03%
667
726
Tax rate %
21.66%
21.93%
19.60%
-26
206
Source: Company, Angel Research
February 12, 2019
2
Lumax Industries |3QFY2019 Result Update
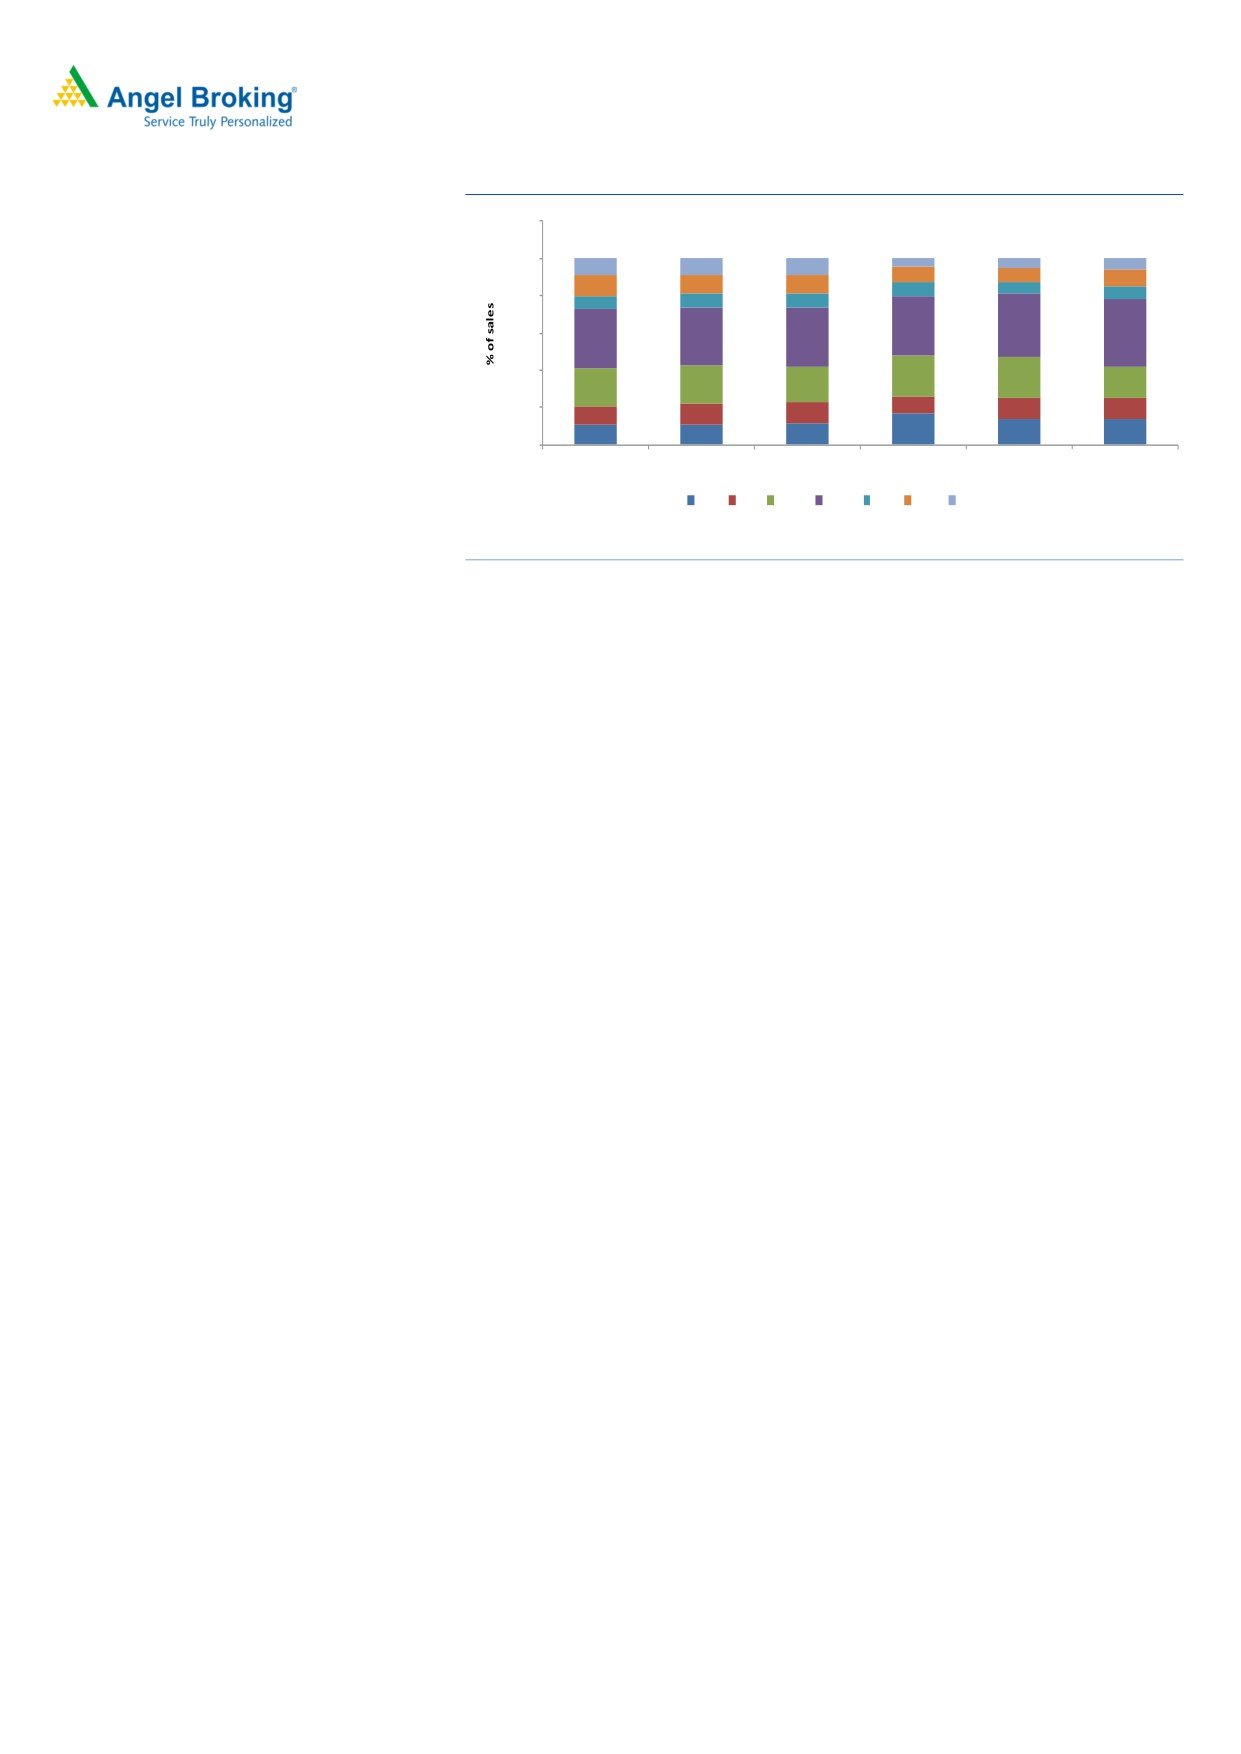
Customer wise sales mix
120.0%
100.0%
4.0%
5.0%
9.0%
9.0%
9.0%
6.0%
9.0%
8.0%
9.0%
11.0%
10.0%
10.0%
7.0%
6.0%
80.0%
7.0%
7.0%
7.0%
7.0%
32.0%
34.0%
60.0%
31.0%
36.0%
32.0%
32.0%
40.0%
22.0%
22.0%
20.0%
21.0%
19.0%
17.0%
20.0%
9.0%
11.0%
11.0%
10.0%
11.0%
11.0%
11.0%
11.0%
12.0%
17.0%
14.0%
14.0%
0.0%
Q2FY18
Q3FY18
Q4FY18
Q1FY19
Q2FY19
Q3FY19
HMSI HML Others Maruti TATA M&M HCIL
Source: Company, Angel Research
Q3FY2019 Key highlights of results and con call
Outlook and Valuation
LIL has reported robust growth of 16% in revenue from `371Cr. in FYQ3FY18
to `431Cr in Q3FY19 despite subdued growth in OEM business under the
quarter review. Growth was mainly attributed to 14-15% growth in value of
the business;
During the quarter LIL has made exceptional gain on ` 36.2Cr by selling land
and building;
Management expects similar kind of profit from associate by end of FY19;
Total capex for FY19 is guided around `80 Cr of which `66 is already been
done and for FY20 expect capex to be around `100-150 Cr. against
technological upgrade, R&D and brownfield expansion. At current level overall
utilization is ~70%;
Management expects localization of LED component to bring down to 50% by
FY20 from 65% currently which will help to improve operating margin.
Valuation
Our long term bet on LIL is bullish and expect LIL to grow above the industry growth
going forward owing to increasing penetration of LED lights. At the CMP of `1461
stock is available at 13X of FY20E EPS of `116. We maintain our BUY recommendation
for target price of ` 2150 with potential upside of 47%.
Risks to our estimates
Downside risk to target revenue and net income is slower than expected adoption
of LED lamp by OEM’s and higher content of import raw material respectively.
Upside risk to target revenue is faster growth in PV and 2W segments.
February 12, 2019
3
Lumax Industries |3QFY2019 Result Update
Income statement
Y/E March (` cr)
FY16
FY17
FY18
FY19E FY20E
Total operating income
1,255
1,271
1,650
1,947
2,278
% chg
10
1
30
18
17
Total Expenditure
1,167
1,170
1,515
1,787
2,075
Raw Material
767
818
1,104
1,295
1,526
Personnel
141
160
189
204
239
Selling and Administration Expenses
76
86
107
126
147
Others Expenses
183
106
115
162
162
EBITDA
89
101
135
160
203
% chg
(65)
14
34
19
27
(% of Net Sales)
7.1%
7.9%
8.2%
8.2%
8.9%
Depreciation& Amortisation
38
41
48
57
67
EBIT
51
60
87
103
136
% chg
(76)
18
46
19
32
(% of Net Sales)
4
5
5
5
6
Interest & other Charges
13
11
8
12
12
Other Income
4
17
19
21
23
Extraordinary Items
-
-
-
36
Recurring PBT
41
65
98
148
147
% chg
(80)
58
51
51
(1)
Tax
4
10
26
46
38
PAT (reported)
37
54
71
102
109
% chg
(82)
48
31
43
6
(% of Net Sales)
2.9
4.3
4.3
5.2
4.8
Basic & Fully Diluted EPS (Rs)
39
58
76
109
116
% chg
122
48
31
43
6
Source: Company, Angel Research
February 12, 2019
4
Lumax Industries |3QFY2019 Result Update
Balance Sheet
Y/E March (`cr)
FY16
FY17
FY18
FY19E
FY20E
SOURCES OF FUNDS
Equity Share Capital
9.4
9.4
9.4
9.4
9.4
Reserves& Surplus
259
300
353
435
523
Shareholders Funds
268
309
362
445
533
Total Loans
95
83
101
101
101
Other Liabilities
51
32
47
50
50
Total Liabilities
415
423
510
596
684
APPLICATION OF FUNDS
Net Block
425
419
532
640
756
Capital Work-in-Progress
-
20
34
5
5
Investments
69
79
88
97
114
Long Term Loans & Advances
31
2
4
4
4
Current Assets
332
348
562
682
750
Inventories
105
116
169
208
218
Sundry Debtors
181
191
318
384
462
Cash
3
1
2
69
58
Loans & Advances
36
-
1
1
1
Investments & Others
7
40
73
20
12
Current liabilities
444
456
721
843
956
Net Current Assets
-111
-109
-159
-161
-206
Other Non Current Asset
1
11
11
11
11
Total Assets
415
423
510
596
684
Source: Company, Angel Research
Cash flow
Y/E March (`cr)
FY16
FY17
FY18
FY19E
FY20E
Profit before tax
41
65
98
148
147
Depreciation
38
41
48
57
67
Change in Working Capital
(0)
7
17
(15)
(45)
Interest / Dividend (Net)
13
11
8
12
12
Direct taxes paid
4
10
26
46
38
Others
(7)
(24)
(40)
(46)
(38)
Cash Flow from Operations
89
111
157
202
181
(Inc.)/ Dec. in Fixed Assets
(38)
(63)
(132)
(119)
(149)
(Inc.)/ Dec. in Investments
1
1
4
(10)
(17)
Cash Flow from Investing
(37)
(62)
(128)
(129)
(166)
Issue of Equity
-
-
-
-
-
Inc./(Dec.) in loans
61
-13
19
-
-
Others
(120)
(27)
(30)
(23)
(27)
Cash Flow from Financing
(59)
(39)
(11)
(23)
(27)
Inc./(Dec.) in Cash
(7)
10
17
50
(11)
Opening Cash balances
18
3
1
19
69
Closing Cash balances
3
1
19
69
58
Source: Company, Angel Research
February 12, 2019
5
Lumax Industries |3QFY2019 Result Update
Key Ratio
Key Ratios
Y/E March
FY16
FY17
FY18
FY19E FY20E
P/E (on FDEPS)
37
25
19
13
13
P/CEPS
15
14
11
9
8
P/BV
5
4
4
3
3
EV/Sales
1
1
1
1
1
EV/EBITDA
16
14
11
9
7
EV / Total Assets
3
3
3
2
2
Per Share Data (Rs)
EPS (Basic)
39
58
76
109
116
EPS (fully diluted)
39
58
76
109
116
Cash EPS
96
102
128
170
188
DPS
0
0
14
21
22
Book Value
287
331
387
476
570
Returns (%)
ROCE
14
15
19
19
21
Angel ROIC (Pre-tax)
15
18
22
24
27
ROE
14
18
20
23
20
Turnover ratios (x)
Inventory / Sales (days)
30
33
37
39
35
Receivables (days)
53
55
70
72
74
Payables (days)
90
94
119
119
110
Source: Company, Angel Research
February 12, 2019
6
Lumax Industries |3QFY2019 Result Update
Research Team Tel: 022 - 39357800
DISCLAIMER:
Angel Broking Limited (hereinafter referred to as “Angel”) is a registered Member of National Stock Exchange of India Limited, Bombay Stock
Exchange Limited, Metropolitan Stock Exchange Limited, Multi Commodity Exchange of India Ltd and National Commodity & Derivatives
Exchange Ltd It is also registered as a Depository Participant with CDSL and Portfolio Manager and Investment Adviser with SEBI. It also has
registration with AMFI as a Mutual Fund Distributor. Angel Broking Limited is a registered entity with SEBI for Research Analyst in terms of SEBI
(Research Analyst) Regulations, 2014 vide registration number INH000000164. Angel or its associates has not been debarred/ suspended by
SEBI or any other regulatory authority for accessing /dealing in securities Market. Angel or its associates/analyst has not received any
compensation / managed or co-managed public offering of securities of the company covered by Analyst during the past twelve months.
This document is solely for the personal information of the recipient, and must not be singularly used as the basis of any investment decision.
Nothing in this document should be construed as investment or financial advice. Each recipient of this document should make such
investigations as they deem necessary to arrive at an independent evaluation of an investment in the securities of the companies referred to in
this document (including the merits and risks involved), and should consult their own advisors to determine the merits and risks of such an
investment.
Reports based on technical and derivative analysis center on studying charts of a stock's price movement, outstanding positions and trading
volume, as opposed to focusing on a company's fundamentals and, as such, may not match with a report on a company's fundamentals.
Investors are advised to refer the Fundamental and Technical Research Reports available on our website to evaluate the contrary view, if any
The information in this document has been printed on the basis of publicly available information, internal data and other reliable sources
believed to be true, but we do not represent that it is accurate or complete and it should not be relied on as such, as this document is for
general guidance only. Angel Broking Limited or any of its affiliates/ group companies shall not be in any way responsible for any loss or
damage that may arise to any person from any inadvertent error in the information contained in this report. Angel Broking Limited has not
independently verified all the information contained within this document. Accordingly, we cannot testify, nor make any representation or
warranty, express or implied, to the accuracy, contents or data contained within this document. While Angel Broking Limited endeavors to
update on a reasonable basis the information discussed in this material, there may be regulatory, compliance, or other reasons that prevent us
from doing so.
This document is being supplied to you solely for your information, and its contents, information or data may not be reproduced, redistributed
or passed on, directly or indirectly.
Neither Angel Broking Limited, nor its directors, employees or affiliates shall be liable for any loss or damage that may arise from or in
connection with the use of this information.
Disclosure of Interest Statement
Lumax Industries
1. Financial interest of research analyst or Angel or his Associate or his relative
No
2. Ownership of 1% or more of the stock by research analyst or Angel or associates or relatives
No
3. Served as an officer, director or employee of the company covered under Research
No
4. Broking relationship with company covered under Research
No
February 12, 2019
7